Economist Bill Nordhaus once referred to gross domestic product (GDP) as one of the “greatest inventions of the twentieth century.” It is hard to imagine that Presidents Hoover and later Roosevelt employed measures as sketchy as freight car load capacity and stock price indices to design policies to combat the Great Depression in 1932–1933. In response to this problem, the Department of Commerce commissioned Nobel laureate Simon Kuznets to develop a set of “national accounts,” which eventually evolved into the modern concept of GDP.
According to the Report: “Onward & Upward: An Update on China and the Global Innovation Index” (By Qiu Mingda and Maria Krol Sinclair), our ability to measure innovation is currently akin to where economists were on the question of GDP in the 1940s. Even the most reputable cross-national comprehensive innovation indices are still in their infancy.
With such limited data, evaluating year-over-year trends is critical. It is important to track each country's progression in as close to real-time as possible.

In IPVN’s 2019 report on “Understanding IP Indicators in the Global Innovation Index (GII)” (published April 2020 on the IPVN portal: http://ipvietnam.gov.vn/), we have analyzed 8 indicators related to intellectual property in order to assess “Vietnam's GII Ranking compared with ASEAN countries in recent years”.
GII’s 2020 data were issued, therefore we can update the 2019 report. The data show that Vietnam’s effort to catch up is continuing apace.
The GII splits a country’s innovation capacity into “inputs,” (human capital and research, infrastructure, institutions, and market and business sophistication) and “outputs” (creative outputs, and knowledge & technology outputs).
As Table 1 shows, of these IP related indicators used to calculate a country’s GII per year, Vietnam’s 2020 GII ranking increased in every category except for two: Patent families filed in at least two offices and Patent applications by origin.
Figure 1: Global innovation indicators related to intellectual property: Vietnam’s Recent Performance

* N/A: data not available
Source: WIPO - Global Innovation Index Report 2011, 2012, 2013, 2014, 2015, 2016, 2017, 2018, 2019, 2020.
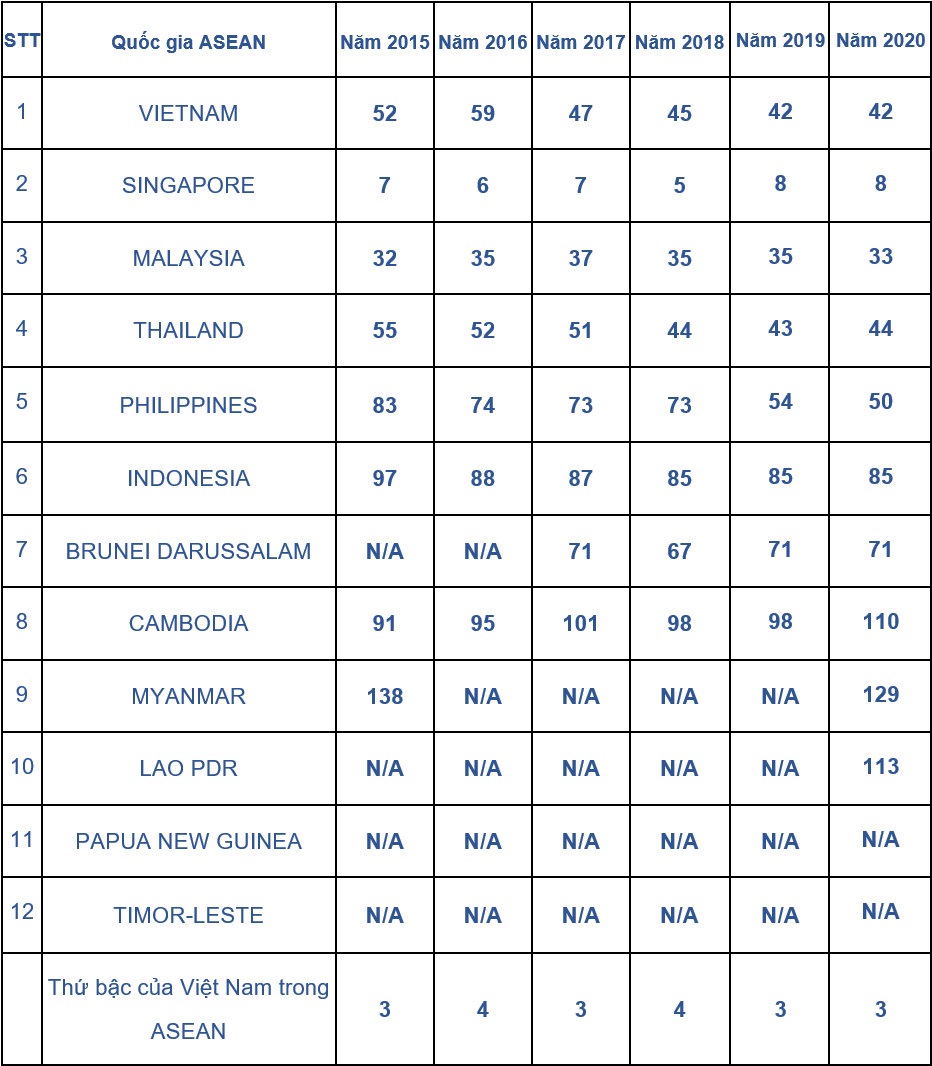
Furthermore, Vietnam’s absolute gains in 2019 and 2020 are notable when compared to its relative gains over other countries in the region. For example, Vietnam's GII ranking relative to ASEAN countries has maintained its 3rd place for 2 consecutive years.
Figure 2: Vietnam's GII ranking relative to ASEAN countries in recent years

* N/A: data not available
Source: WIPO - Global Innovation Index Report 2015, 2016, 2017, 2018, 2019, 2020.
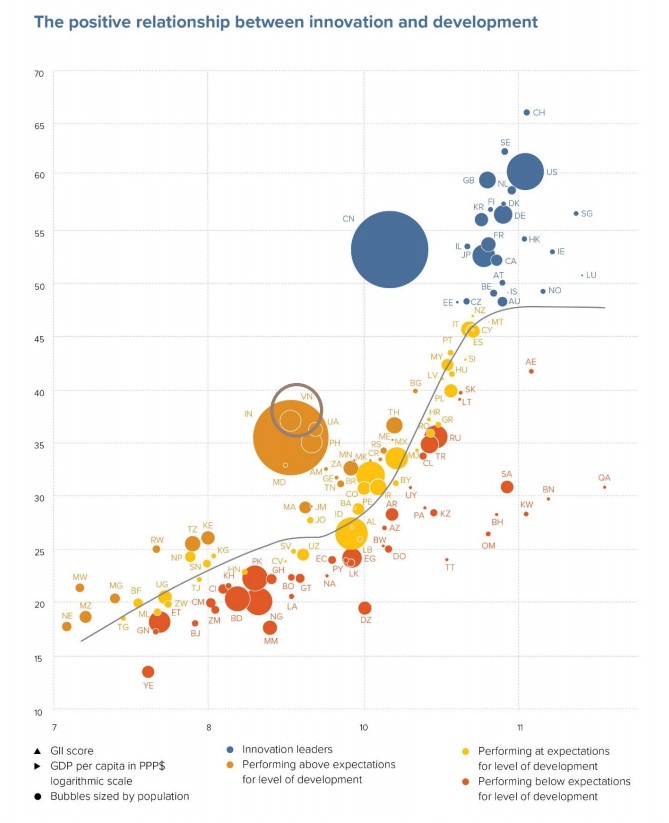
In terms of global rankings, Vietnam’s performance in 2020 continues to stand out as an outlier from the developing world.
The bubble chart below shows the relationship between income levels (GDP per capita) and innovation performance (GII score). The trend line gives an indication of the expected innovation performance according to income level. Economies appearing above the trend line are performing better than expected and those below are performing below expectations.

Relative to GDP, Viet Nam’s performance is above expectations for its level of development.
Overall, Viet Nam performs best in Market sophistication and its weakest performance is in Institutions.
*Reference:
1. Global Innovation Index 2020 (WIPO)
2. Onward & Upward: An Update on China and the Global Innovation Index (By Qiu Mingda and Maria Krol Sinclair).